


EFcalc - Event/Fault Tree Calculator |
|
|
|
|
|
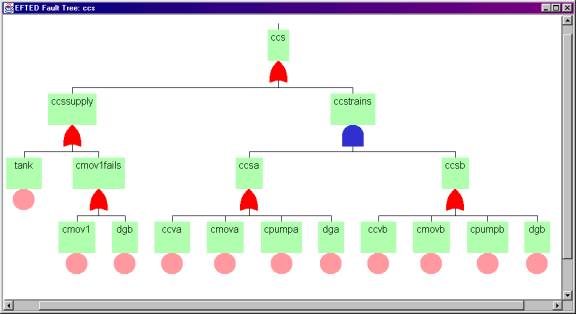
The following example problem is used in the popular SAPHIRE code, used by many in the probabilistic risk analysis field. The problem has two fault trees, shown below:
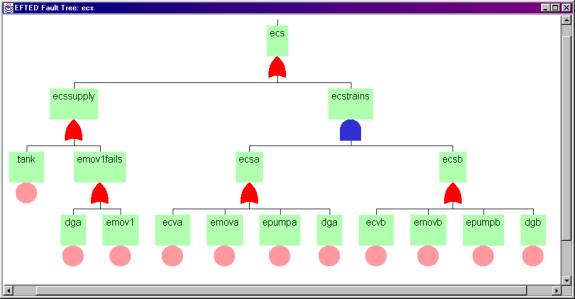
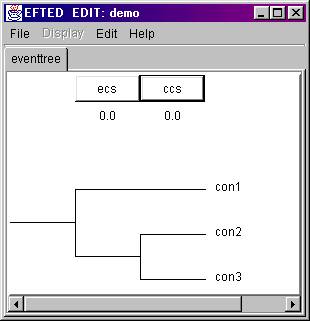
The problem has one event tree with only two top-level systems, ecs and ccs.
To compute this problem using EFcalc, the following input files are used (default values for demo.cal were used):
demo.bas -
     tank     0.0 "RWST supply to the inject and cool systems"
     dga      0.0 "Emergency diesel generator A"
     dgb      0.0 "Emergency diesel generator B"
     cmov1    0.0 "CCS suction isolation valve"
     emov1    0.0 "ECS suction isolation valve"
     ccva     0.0 "CCS Train A pump discharge check valve"
     cmova    0.0 "CCS Train A pump discharge isolation valve"
     cpumpa   0.0 "CCS Train A motor-driven pump"
     ccvb     0.0 "CCS Train B pump discharge check valve"
     cmovb    0.0 "CCS Train B pump discharge isolation valve"
     cpumpb   0.0 "CCS Train B motor-driven pump"
     ecva     0.0 "ECS Train A pump discharge check valve"
     emova    0.0 "ECS Train A pump discharge isolation valve"
     epumpa   0.0 "ECS Train A motor-driven pump"
     ecvb     0.0 "ECS Train B pump discharge check valve"
     emovb    0.0 "ECS Train B pump discharge isolation valve"
     epumpb   0.0 "ECS Train B motor-driven pump"
demo.equ
     ccs    or ccssupply ccstrains "CCS Fails to Spray Water in  Cntnmnt"
     ccssupply  or  tank cmov1fails       "No Water to the Pump Trains"
     cmov1fails or  cmov1 dgb             "C-MOV-1 Fails to Open"
     ccstrains  and ccsa ccsb             "Both Pump Trains Fail to Inject"
     ccsa       or  ccva cmova cpumpa dga "CCS Train A Fails to Supply Flow"
     ccsb       or  ccvb cmovb cpumpb dgb "CCS Train B Fails to Supply Flow"
     ecs        or  ecssupply ecstrains   "ECS Fails to Inj Wat in the R Ves"
     ecssupply  or  tank emov1fails       "No Water to the Pump Trains"
     emov1fails or  dga emov1             "E-MOV-1 Fails to Open"
     ecstrains  and ecsa ecsb             "Both Pump Trains Fail to Inject"
     ecsa       or  ecva emova epumpa dga "ECS Train A Fails to Inject"
     ecsb       or  ecvb emovb epumpb dgb "ECS Train B Fails to Inject"
demo.etr
     2
     ecs 0.0 0.0
     ccs 0.0 0.0
     3 eventtree "The SAPHIRE Event Tree"
     con1   -ecs
     con2    ecs -ccs
     con3    ecs  ccs
demo.con
     con1 "All Right"
     con2 "Large Release"
     con3 "Small Release"
demo.dmg
     tank     0.0000001
     dga      0.02
     dgb      0.02
     cmov1    0.001
     emov1    0.001
     ccva     0.0001
     cmova    0.005
     cpumpa   0.003
     ccvb     0.0001
     cmovb    0.005
     cpumpb   0.003
     ecva     0.0001
     emova    0.005
     epumpa   0.003
     ecvb     0.0001
     emovb    0.005
     epumpb   0.003
Running EFcalc produce the following *.ans file:
     1     Number of Event Trees
     3     Sequence probabilities and uncertainties
       0.978799  0.000000
       0.020444  0.000000
       0.000757  0.000000
     3     Consequence probabilities and uncertainties
       1    0.978799  0.000000
       2    0.020444  0.000000
       3    0.000757  0.000000
     2     Event tree branch probabilities
         3    2  0.0357
         3    1  0.0212
     cmov1fails  0.020980  0.000000
     ccsa        0.027923  0.000000
     ccsb        0.027923  0.000000
     emov1fails  0.020980  0.000000
     ecsa        0.027923  0.000000
     ecsb        0.027923  0.000000
     ccssupply   0.020980  0.000000
     ccstrains   0.000780  0.000000
     ecssupply   0.020980  0.000000
     ecstrains   0.000780  0.000000
     ccs         0.021201  0.000000
     ecs         0.021201  0.000000
Note that this example only had only 3 common components, so the direct method of computation was used. This is the reason that the uncertainty for every calculated value is zero. Had the Monte Carlo approach been used, these uncertainties would have had values.
The report file, demo.rpt, produced by the EFcalc run looks like the following:
     ---------------------------------------------------------------------
       Reading Main Input Files...
       Reading basic event definitions from  demo.bas
       Reading gate equations from           demo.equ
       Reading event tree sequences from     demo.etr
       Reading calculation parameters from   demo.cal
       Reading consequence names from        demo.con
       Reading failure probabilities from    demo.dmg
     ---------------------------------------------------------------------
     Setting up the basic event probabilities...
       Resetting all basic event probabilities to zero.
     ---------------------------------------------------------------------
     Manipulating and Checking Data...
       Setting consquences for each event tree
       Checking calculational parameters
       Checking basic event probabilities
       Checking simple failure probabilities of top level gates
       Checking gate (12) and basic event (17) usage
         Number of basic events:         17
         Number of events not used:       0
         Number of events used once:     14
         Number of common events:         3
         Number of house events:          0
         Number of commons (exc. house):  3
     Problem Overview
       Number of basic events      17
       Number of equations         12
       Number of top-level systems  2
       Number of event trees        1
       Number of consequences       3
     ---------------------------------------------------------------------
     Solving the Event Tree/Fault Tree System...
       Method of Solution:  Brute force on common variables
       Determining event tree branch probabilities
     ---------------------------------------------------------------------
     Event Tree Event Tree 1
       seq   1    1      0.978799  0.000000
       seq   2    2      0.020444  0.000000
       seq   3    3      0.000757  0.000000
          total   1.000000
       con 1    con1       0.978799  0.000000
       con 2    con2       0.020444  0.000000
       con 3    con3       0.000757  0.000000
          total   1.000000
With different failure probabilities in the demo.dmg file, different results are obtained:
| name | Standard | Case 2 | Case 3 | |
|---|---|---|---|---|
| tank | 10-7 | 10-6 | 10-5 | |
| dga | 0.02 | 0.2 | 0.2 | |
| dgb | 0.02 | 0.2 | 0.2 | |
| cmov1 | 0.001 | 0.01 | 0.1 | |
| emov1 | 0.001 | 0.01 | 0.1 | |
| ccva | 0.0001 | 0.001 | 0.01 | |
| cmova | 0.005 | 0.05 | 0.5 | |
| cpumpa | 0.003 | 0.03 | 0.3 | |
| ccvb | 0.0001 | 0.001 | 0.01 | |
| cmovb | 0.005 | 0.05 | 0.5 | |
| cpumpb | 0.003 | 0.03 | 0.3 | |
| ecva | 0.0001 | 0.001 | 0.01 | |
| emova | 0.005 | 0.05 | 0.5 | |
| epumpa | 0.003 | 0.03 | 0.3 | |
| ecvb | 0.0001 | 0.001 | 0.01 | |
| emovb | 0.005 | 0.05 | 0.5 | |
| epumpb | 0.003 | 0.03 | 0.3 | |
| Results | Standard | Case 2 | Case 3 | |
| Seq 1 | /ecs | 0.9788 | 0.7754 | 0.3799 |
| Seq 2 | ecs /ccs | 0.0204 | 0.1561 | 0.2097 |
| Seq 3 | ecs ccs | 0.0008 | 0.0685 | 0.4104 |
Oak Ridge National Laboratory, 2004