


EFTed - Event/Fault Tree Editor and Display |
|
|
|
|
|
The results of the event/fault tree calculation are shown for each sequence of each event tree and the failure probabilities for each gate and basic event is shown in the fault trees. Failure probabilities of each event tree branch point are also given. Only event trees that have a probability of occurring are shown in the tab list.
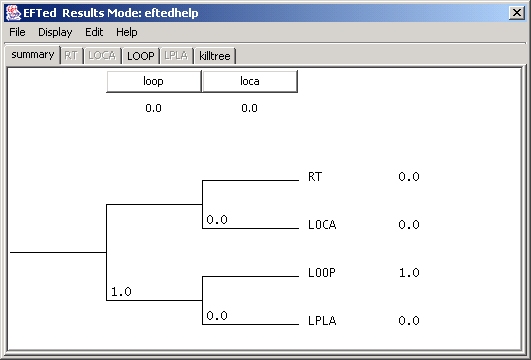
In the example above, the damage to the plant was such that off-site power was lost with a 100% probability, making the sequences in the "RT" and "LOCA" event trees impossible. Only the "LOOP" event tree has a non-zero result that can be displayed.
For a slave event tree, the highest probability of a certain consequence can be highlighted in red. The consequence of interest is chosen using the menu bar "Display/Choose Active Consequence". An example for "moderate - moderate core damage" is shown below.

The red line immiedatlely shows the user which system will likely cause the selected consequence. The user can then display that gate by left clicking on the top-level gate name.
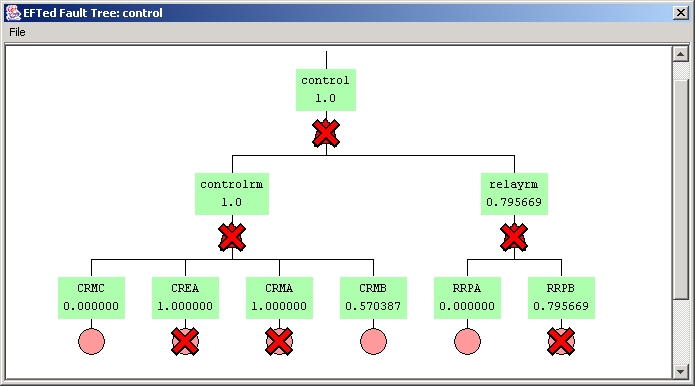
In this example, the "ep" fault tree failed due to the failure of "control", which is shown above. Note that gates and basic events with high failure probabilities are easily found with the large-red "X" placed on their symbols. The threshold value, above which the red "X"'s will show, can be changed by the user by using the menu "Display/Set Kill Threshold" command. The above example has the kill threshold set to 0.75.
Oak Ridge National Laboratory, 2004